Introduction

This is the first National Coastal and Marine Spatial Biodiversity Plan for the coast and ocean around the South African mainland, comprising the national Coastal and Marine CBA Map v1.2 and accompanying sea-use guidelines. It is being developed using the software, Marxan, to run a systematic biodiversity plan to identify the biodiversity priority areas. It is therefore based on the principles of representation, persistence and target setting, and characteristics of: complementarily and spatial efficiency; conflict avoidance; connectivity; data-driven; and explicit and repeatable, as required by the Technical Guidelines for CBA Maps. The overall goal is to safeguard a sufficient, representative sample of coastal and marine biodiversity that can persist into the future, in support of sustainable economic development. This work will continue through other initiatives, and iterative improvements of the National Coastal and Marine Spatial Biodiversity Plan are needed over the next few years. Version 1.2 of the CBA Map and sea-use guidelines are displayed below.
Resources
There are a number of different resources for this work that are available; have a look to see which products are most suited to your needs. In addition to the options below, we also recommend looking at the other additional resources related to this work.
SHAPEFILES: The CBA Map data are available for download from the sidebar. NOTE: For most users of the CBA Map, we recommend downloading CBAMap_v1_2 (recommended version) - this is the dataset that matches the map below and is the version in the main text of the technical report. The CBAMap_v1_2-detailed dataset is recommended only for specialised users; it matches the marine portion of the map in Appendix 3 of the technical report.
TECHNICAL REPORT: The National Coastal and Marine Spatial Biodiversity Plan Version 1.2 (Released 04-12-2022) technical report is available from the sidebar. This is the full detailed documentation of how the CBA Map and sea-use guidelines were developed.
TECHNICAL SUMMARY: This is a short summary of the full technical report that is in more detail than the factsheet. It is aimed at technical users who wish to have a quick overview of the CBA Map and sea-use guidelines. It is available for download from the sidebar.
FACTSHEET: The factsheet is a non-technical summary of the CBA Map and sea-use guidelines, intended for a policymakers and general users. It is available for download from the sidebar.
SCIENTIFIC PUBLICATION: A peer-reviewed paper was published in Ocean and Coastal Management. If you are unable to access the paper, please request a copy from the authors via email or on ResearchGate. For a limited time, 50 free copies of the paper are available here.
STORYMAP: An interactive summary of the CBA Map and sea-use guidelines is available here.
VIDEO SUMMARY: For those wanting the short version of the updates in Version 1.2, they are explained in the video below (click the [ ] icon in the bottom right corner to view full screen):
National Coastal and Marine CBA Map Version 1.2
The National Coastal and Marine CBA Map is built using a series of input layers in two classes: biodiversity features; and design elements. In Version 1.2 there are 976 biodiversity features and design elements. The biodiversity features (n=437) include: ecosystem types (n=190 features); species such as turtles, seabirds, dolphins, whales, seals, sharks and rays (n=188 features); unique or special habitats or features (n = 15); ecological processes (n=18); ecological infrastructure (n=2); and existing priority areas (n=24). The design elements (n=539) include: edge-matching and aligning priority areas across land and sea, shared international boundaries and with existing initiatives (n=52); culturally important areas (n=6); ecological condition (n=332); and climate-change adaptation (n=149). The list of features included in the spatial biodiversity plan has been growing rapidly (Beta 1=541; Beta 2=615; Version 1=886; Version 1.1=911, Version 1.2=976), and the number of datasets in each of these categories that are used in the spatial biodiversity plan is expected to increase in future versions. The cost layer used in the analysis comprises four components, two of which specifically aim to reduce conflict with 19 different sectors. The other two components are cumulative impact to marine ecosystem types, and area of the planning units. Marxan was used to do the spatial prioritisation.
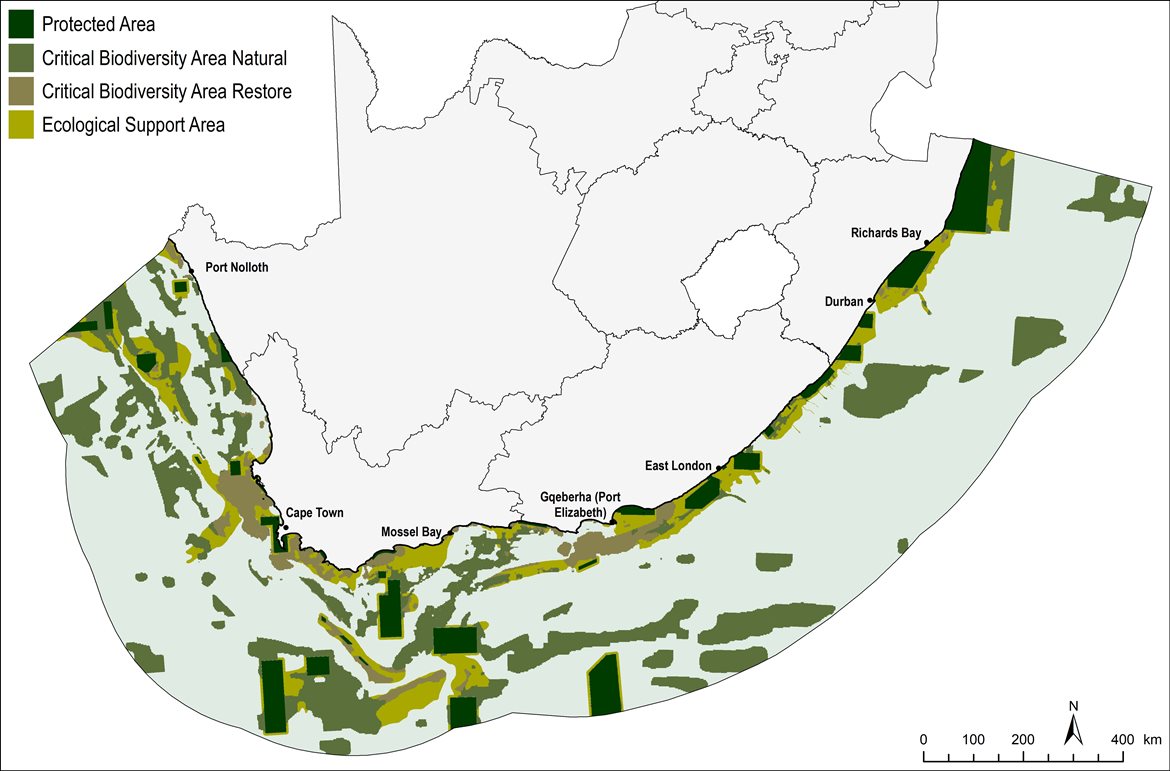
National Coastal and Marine CBA Map v1.2 (Released 04-12-2022)
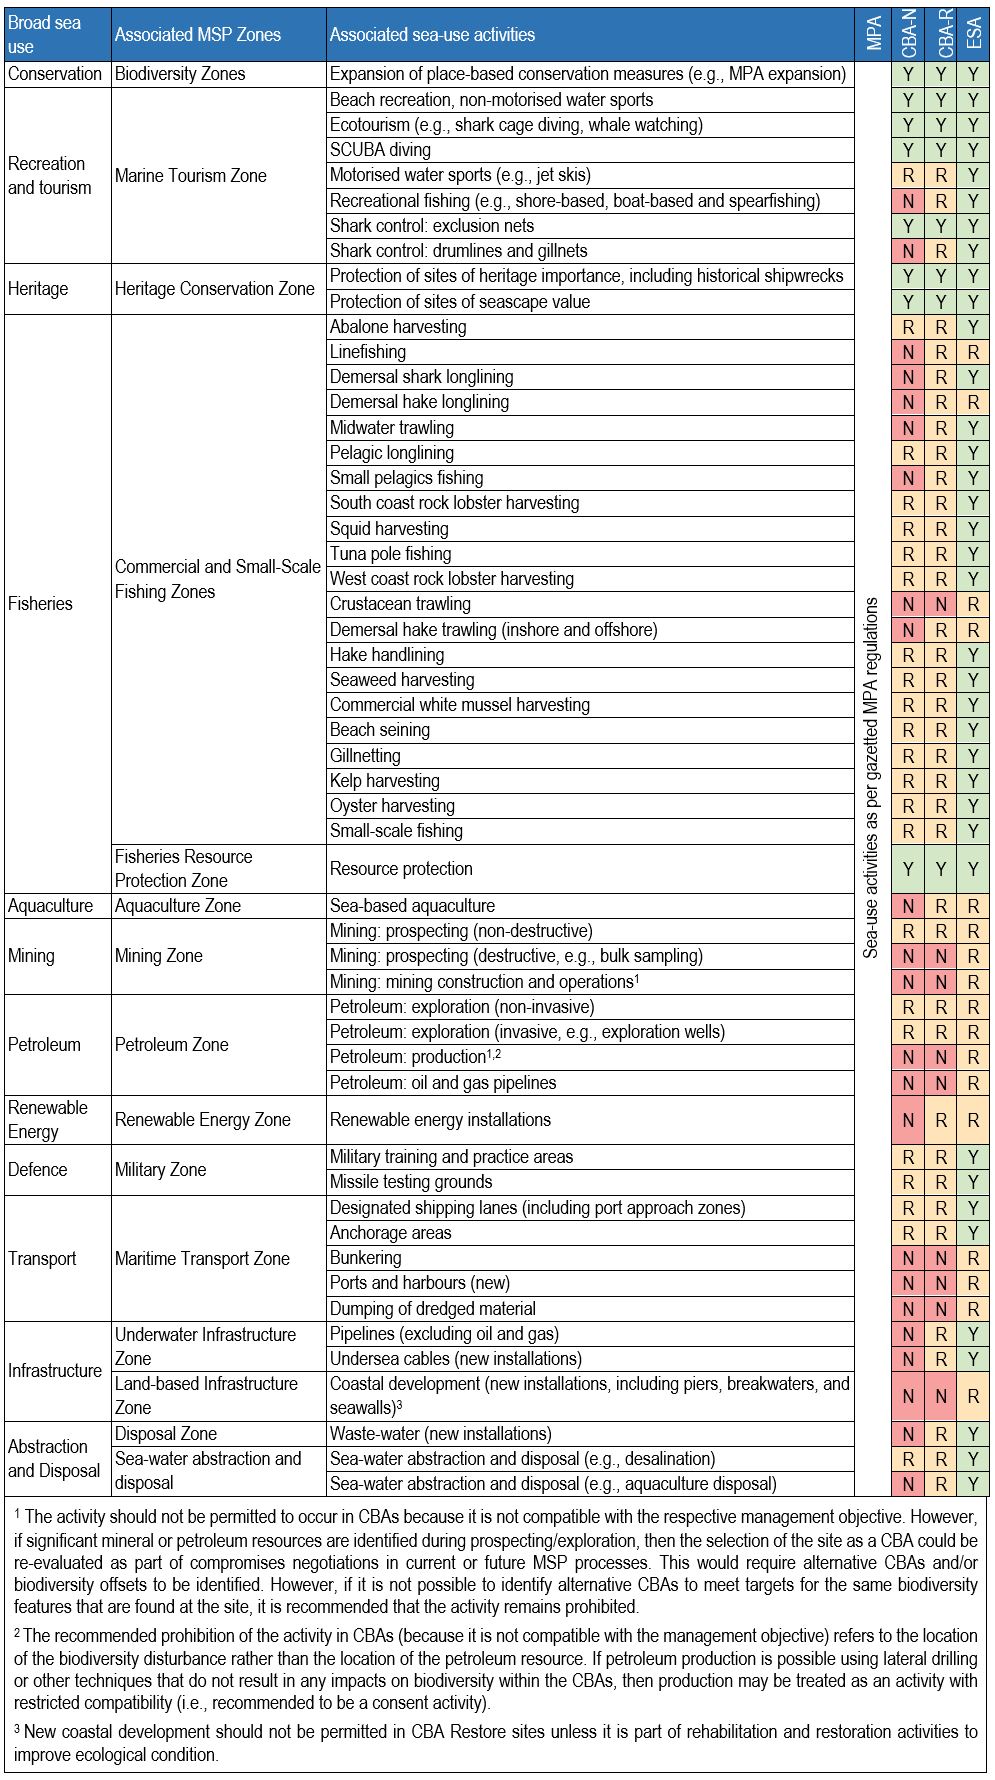
Sea-use Guidelines
The sea-use guidelines were developed through a series of workshops, first discussed at the Biodiversity Planning Forum 2018. They build on the proposed management recommendations accompanying the proposed EBSA zoning that have been discussed at two national workshops. The evaluation of activity compatibility was based largely on the ecosystem-pressure matrix from the NBA 2018 marine assessment.
Sea-use guidelines Version 1.2 (Released 12-04-2022). List of all sea-use activities, grouped by their broad sea use and Marine Spatial Planning (MSP) Zones, and assessed according to their compatibility with the management objective of Critical Biodiversity Areas (CBA-N = CBA Natural; CBA-R = CBA Restore) and Ecological Support Areas (ESA). Activity compatibility is given as Y = yes, compatible, R = restricted compatibility, or N = not compatible. Marine Protected Areas (MPAs) are managed according to their gazetted regulations.